
Market intelligence briefing
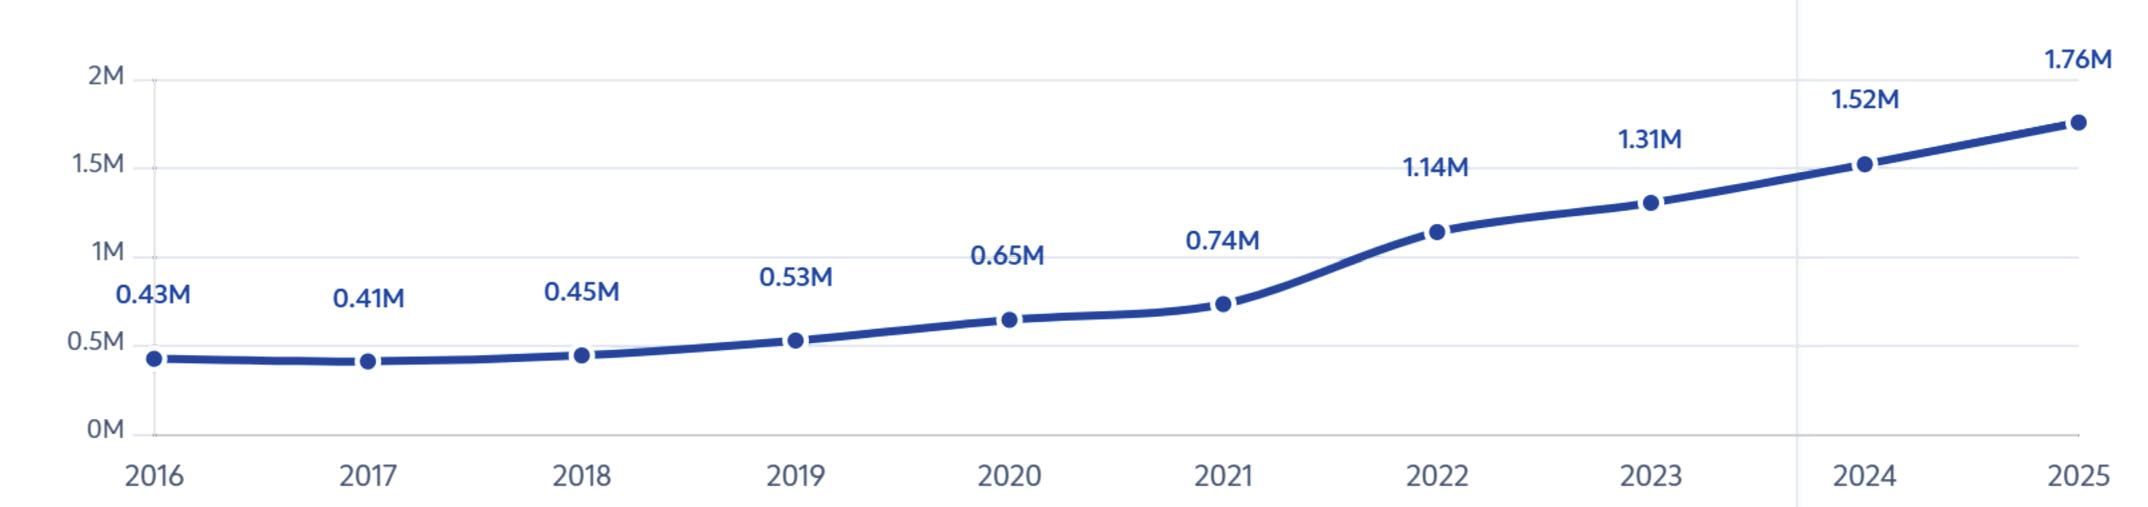
Saudi Arabia’s Micro, Small and Medium enterprise base reached 1.76 million active businesses in 2025, more than four times its 2016 size. This report examines where that growth occurred, how financing reaches each enterprise tier, how often firms move up or down in size, and what the Food and Beverage sector reveals about the wider SME economy.
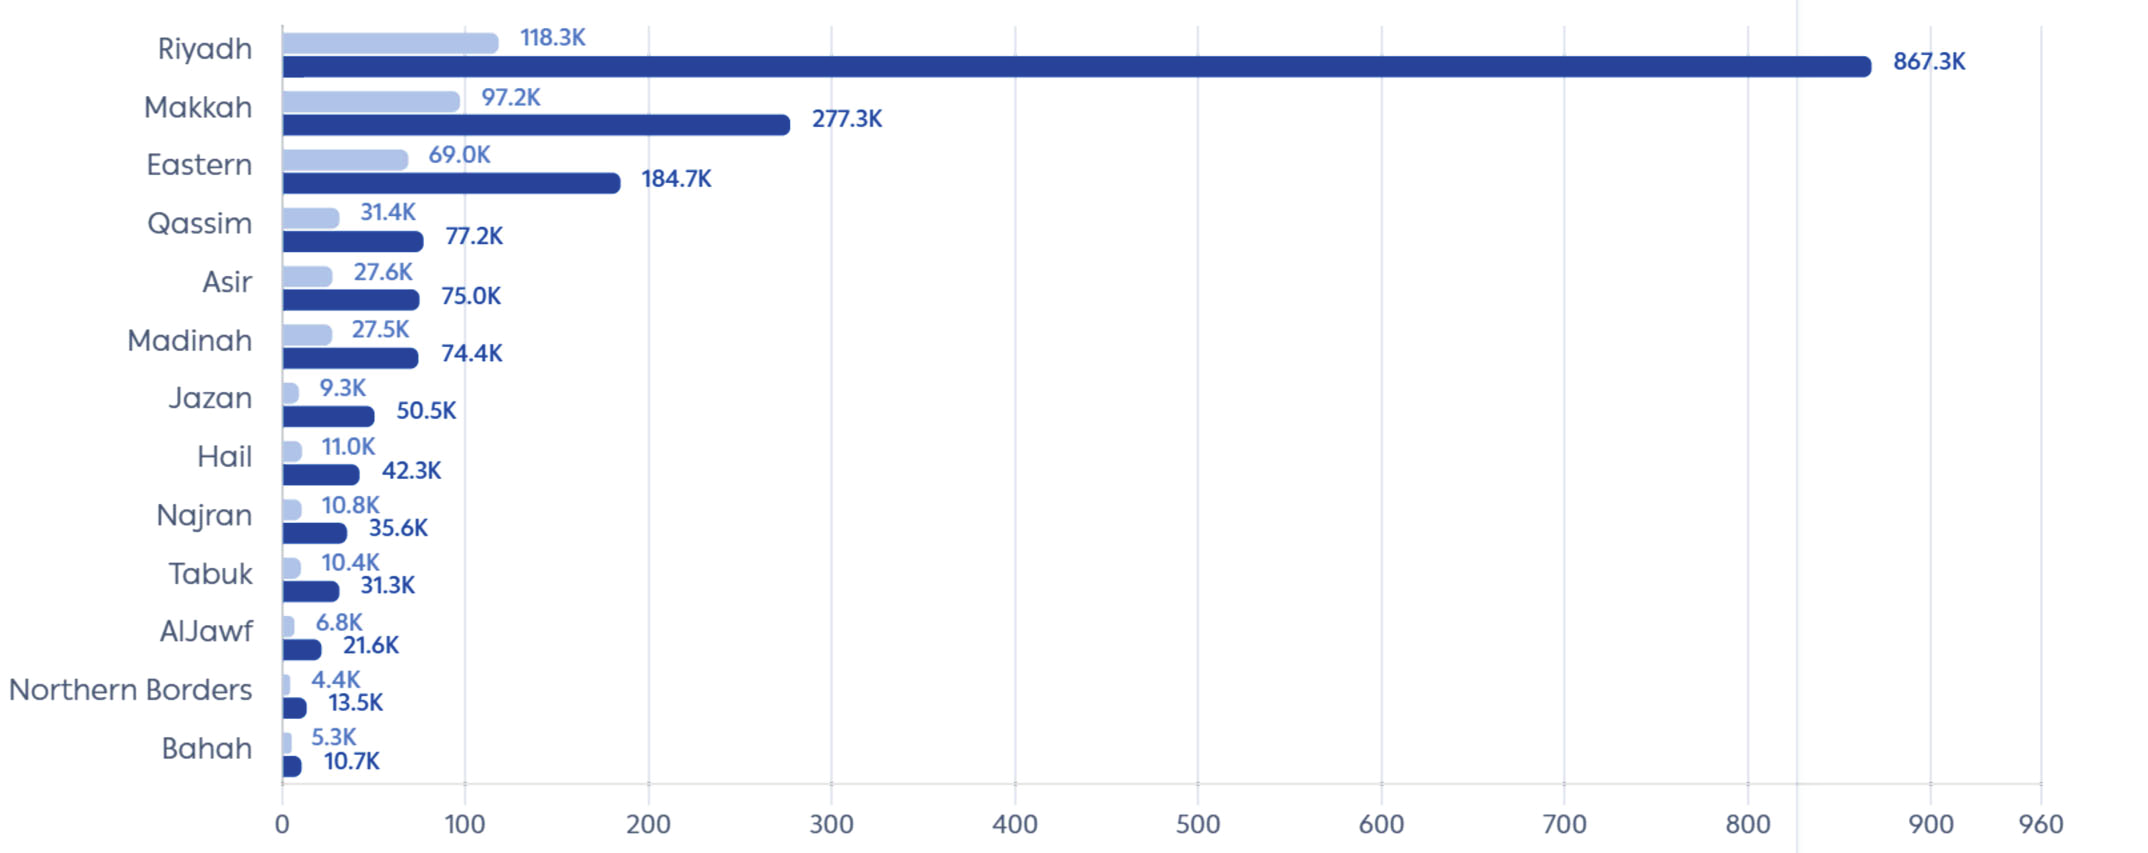
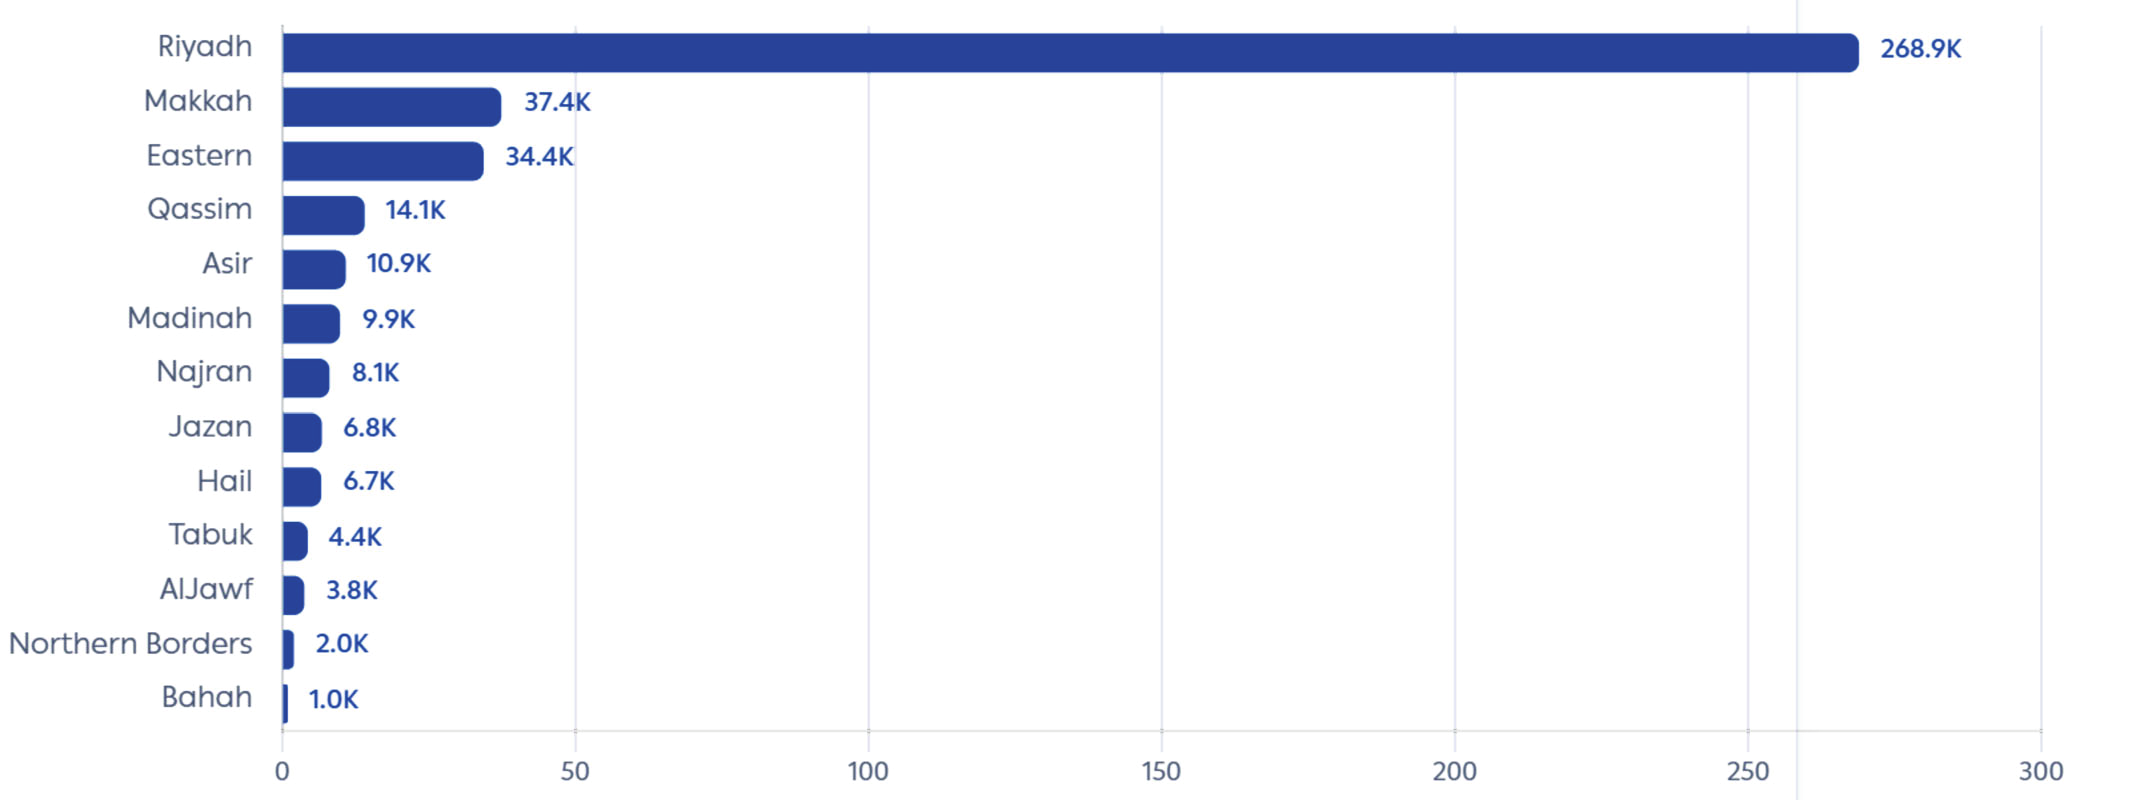
The findings point to a market that is expanding rapidly but unevenly. Riyadh now accounts for almost half of active MSM enterprises and nearly two thirds of new registrations. Micro enterprises dominate the national mix, while the likelihood of graduating into a larger tier remains low. Credit per enterprise has risen within every size tier, but the national average hides those gains because Micro businesses now represent such a large share of the market.
Key findings




Executive commentary: Saudi Arabia’s SME story is not only about the number of businesses being created. The structure of the market has changed. Growth is increasingly concentrated in Riyadh and in the Micro tier. That creates a wide entrepreneurial base, but the mobility data shows that forming a business and scaling one are very different challenges.
1. Enterprise growth and regional concentration
The active MSM enterprise base grew at a compound annual rate of 17.0% between 2016 and 2025. The sharpest annual change came in 2022, when the active base jumped by 54.7%. The report links this break in the trend to easier access to capital, expanded training and upskilling, a surge in venture funding, and targeted initiatives including Monsha’at’s Thakaa technology center and the National Strategy for Data and AI.
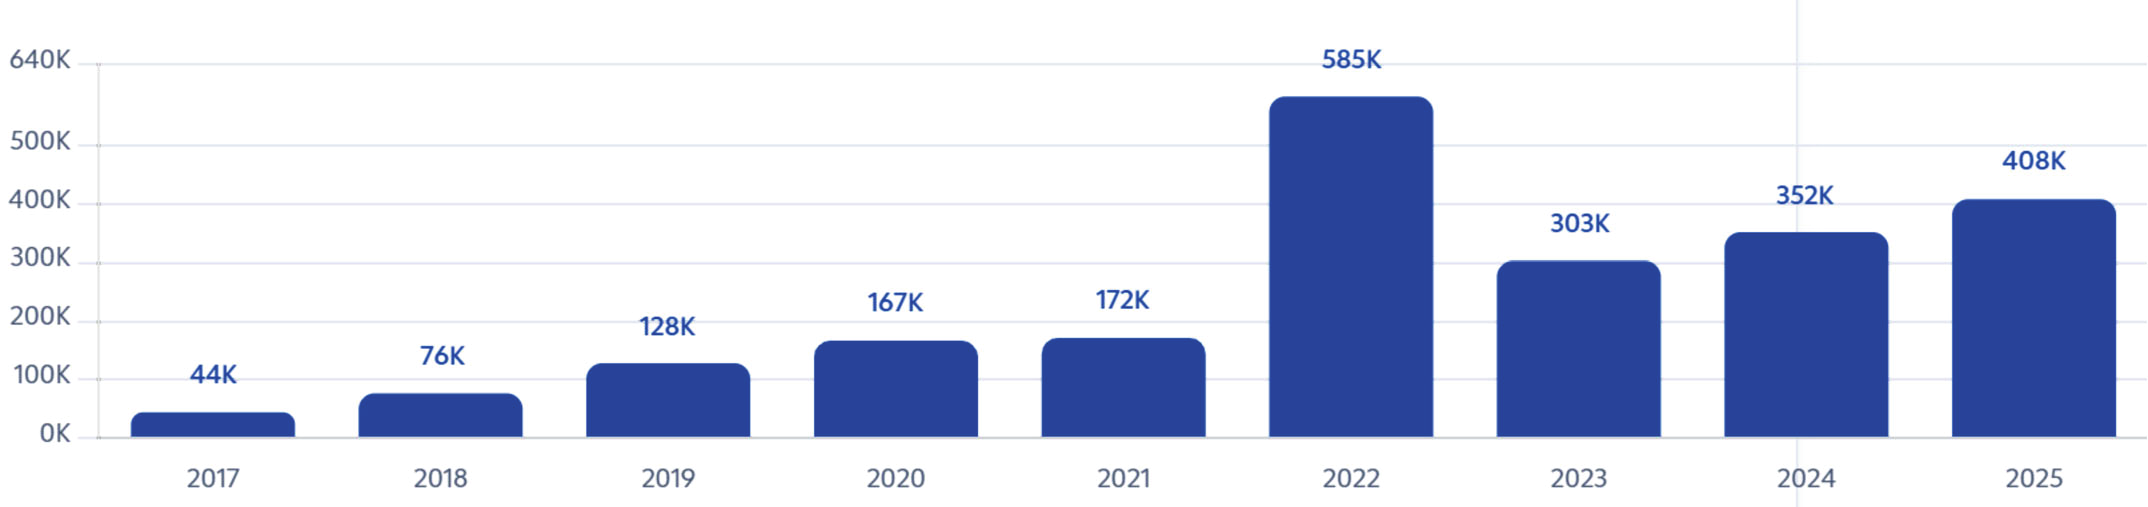
New registrations accelerated even faster. The 585,000 enterprises registered in 2022 exceeded the combined total for 2019, 2020 and 2021. Annual formations later settled at a still-elevated 303,000 to 408,000 during 2023-2025.
Active MSM enterprises, 2016-2025
New MSM registrations, 2017-2025
Active MSM enterprises by region, 2016 versus 2025
New registrations by region, 2025
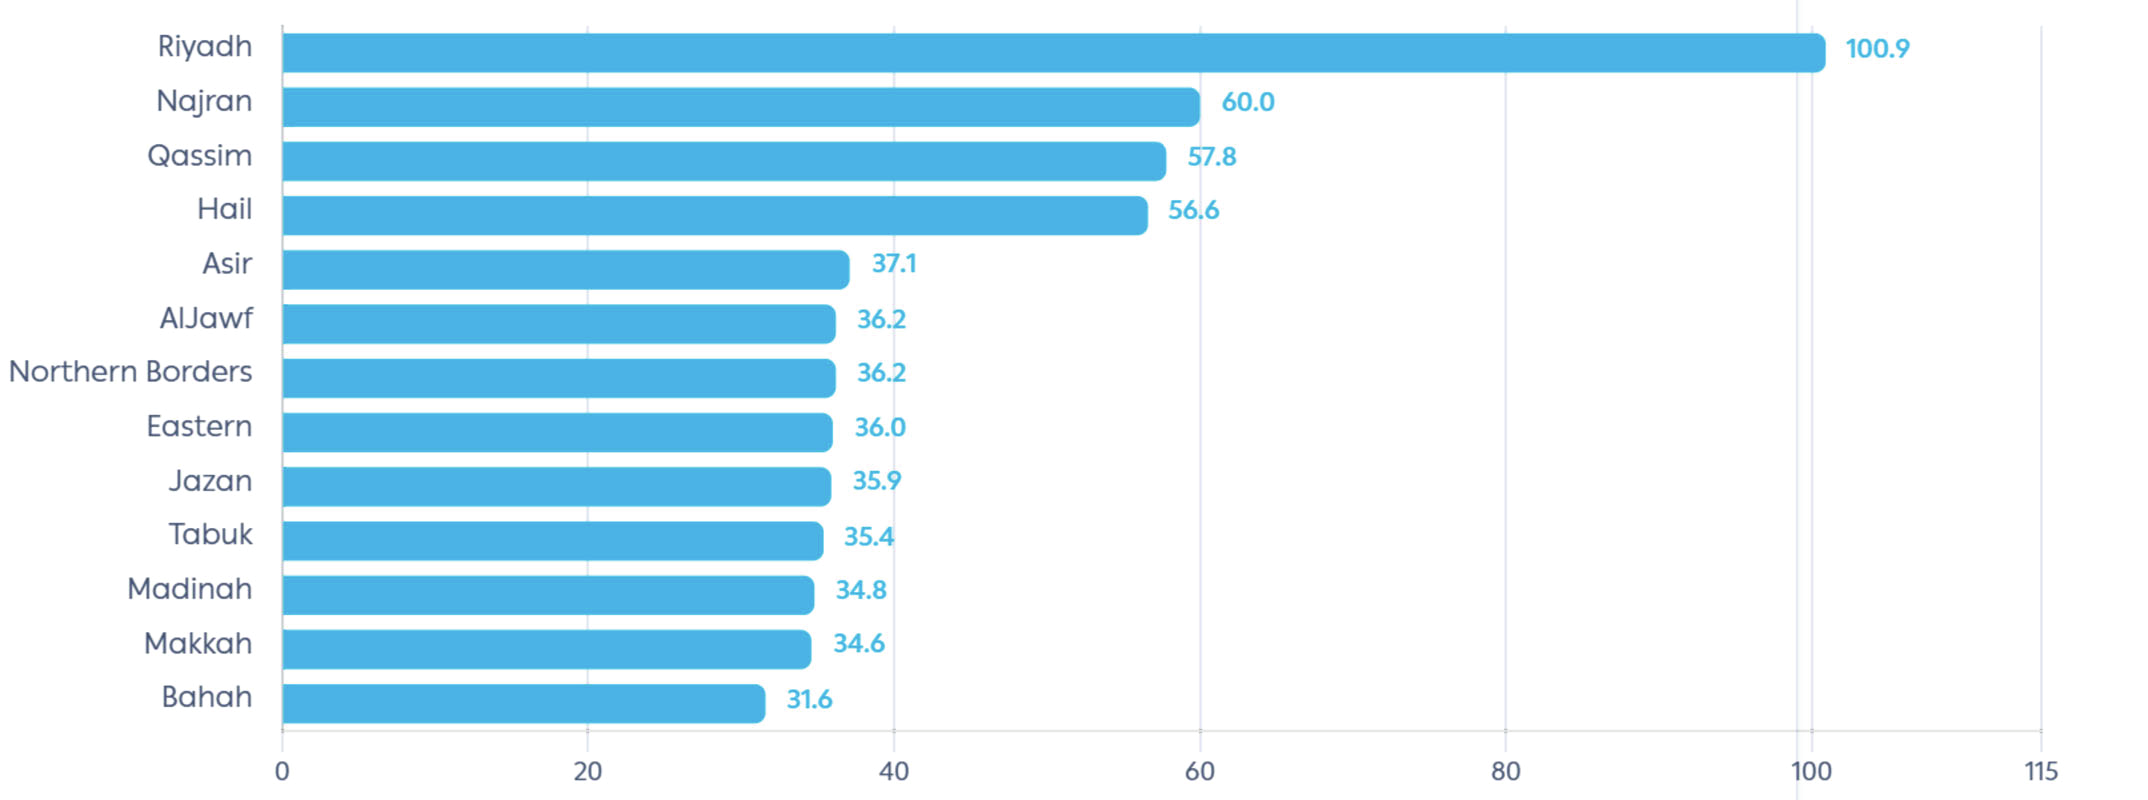
MSM enterprise density by region, 2025
What the regional data means
Riyadh’s lead is not simply a population effect. The capital also has the highest MSM enterprise density in the Kingdom. The report notes that Riyadh and the Eastern Province are estimated to contribute similar shares of national output, yet Riyadh has built almost three times as many small businesses per resident. This suggests two economies of comparable scale but very different structures: Riyadh is distributed across more enterprise sizes and sectors, while the Eastern Province leans more heavily on large, capital-intensive industries.
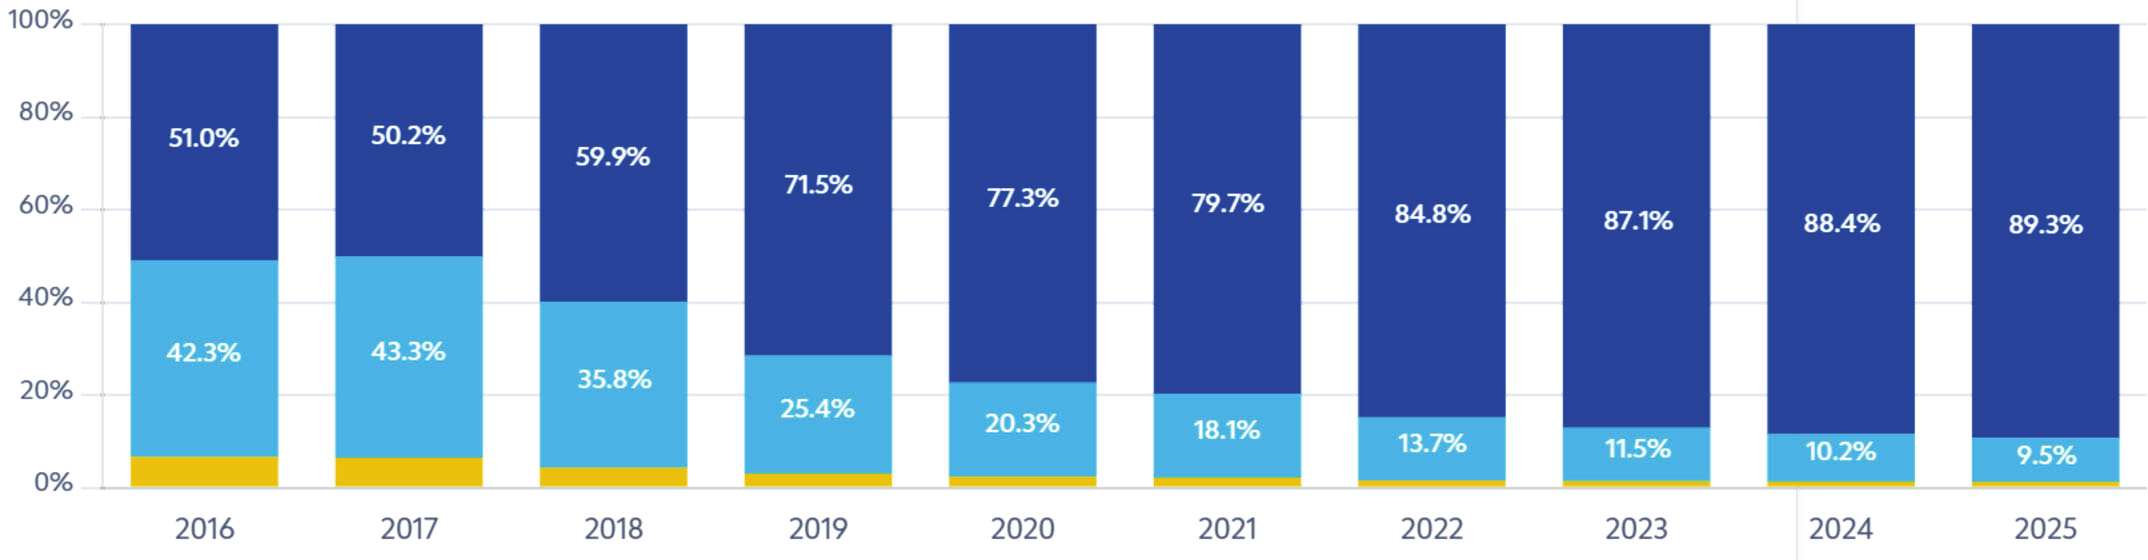
2. The enterprise mix has shifted toward Micro businesses
In 2016, the national MSM base was divided relatively evenly between Micro and Small enterprises: 51.0% Micro, 42.3% Small and 6.7% Medium. By 2025, Micro enterprises represented 89.3% of the total, while Small fell to 9.5% and Medium to about 1%. The change is not only a percentage effect: the absolute number of Small enterprises has barely grown since 2016.
National enterprise mix, 2016-2025
Enterprise mix by region, 2025
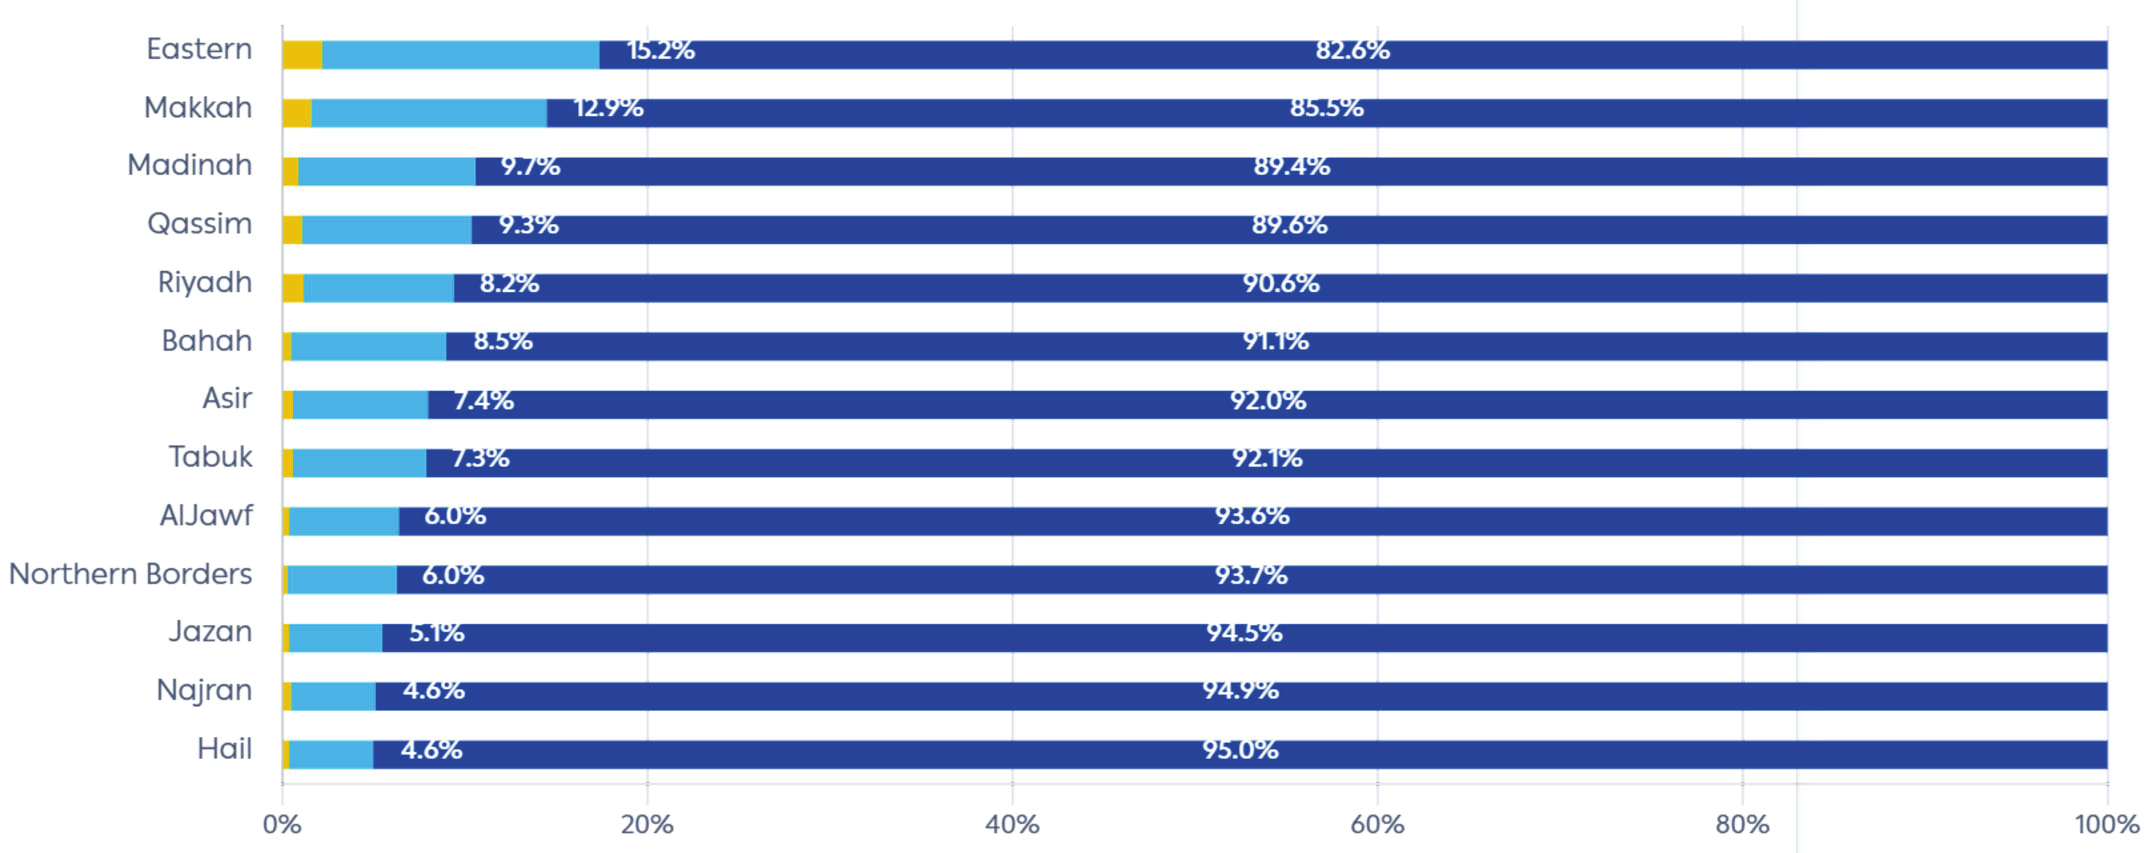
Commentary: A large Micro base can be a sign of broad participation and accessible business formation. It can also place more weight on the financing and support systems that help viable firms become durable Small and Medium enterprises. The next section tests whether that progression is happening.
3. SME financing and enterprise mobility
Credit intensity
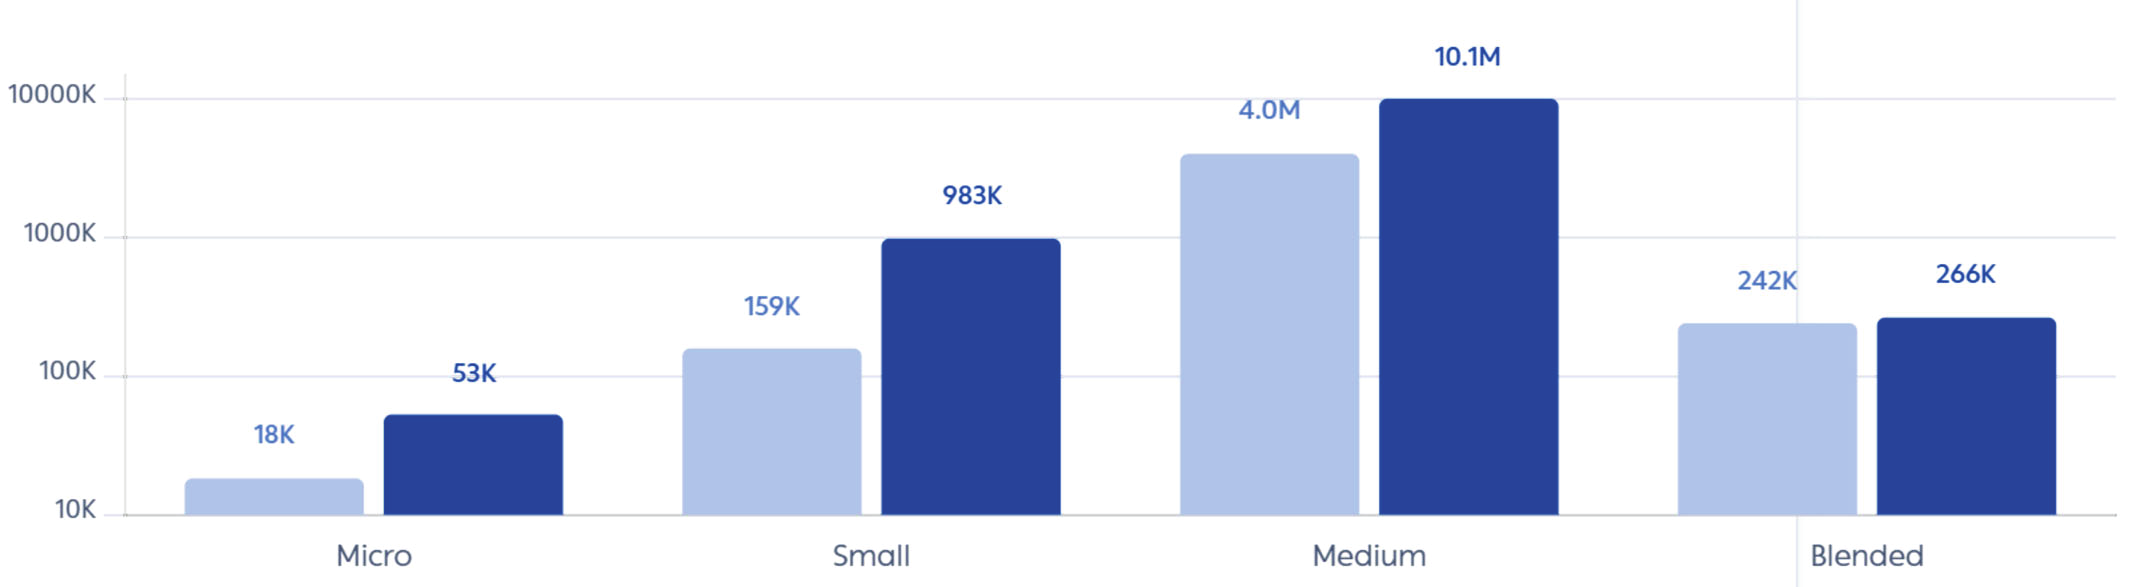
To estimate credit intensity, the report divides total MSME credit outstanding from the Saudi Central Bank by the number of enterprises in each size tier. The blended result rose by only 10% from 2018 to 2025, from SAR 242,000 to SAR 266,000 per enterprise. That blended figure masks substantial gains within every tier: Micro credit per enterprise rose from SAR 18,000 to SAR 53,000, Small from SAR 159,000 to SAR 983,000, and Medium from SAR 4.0 million to SAR 10.1 million.
Credit per enterprise, 2018 versus 2025
Mobility: how often enterprises move between size tiers
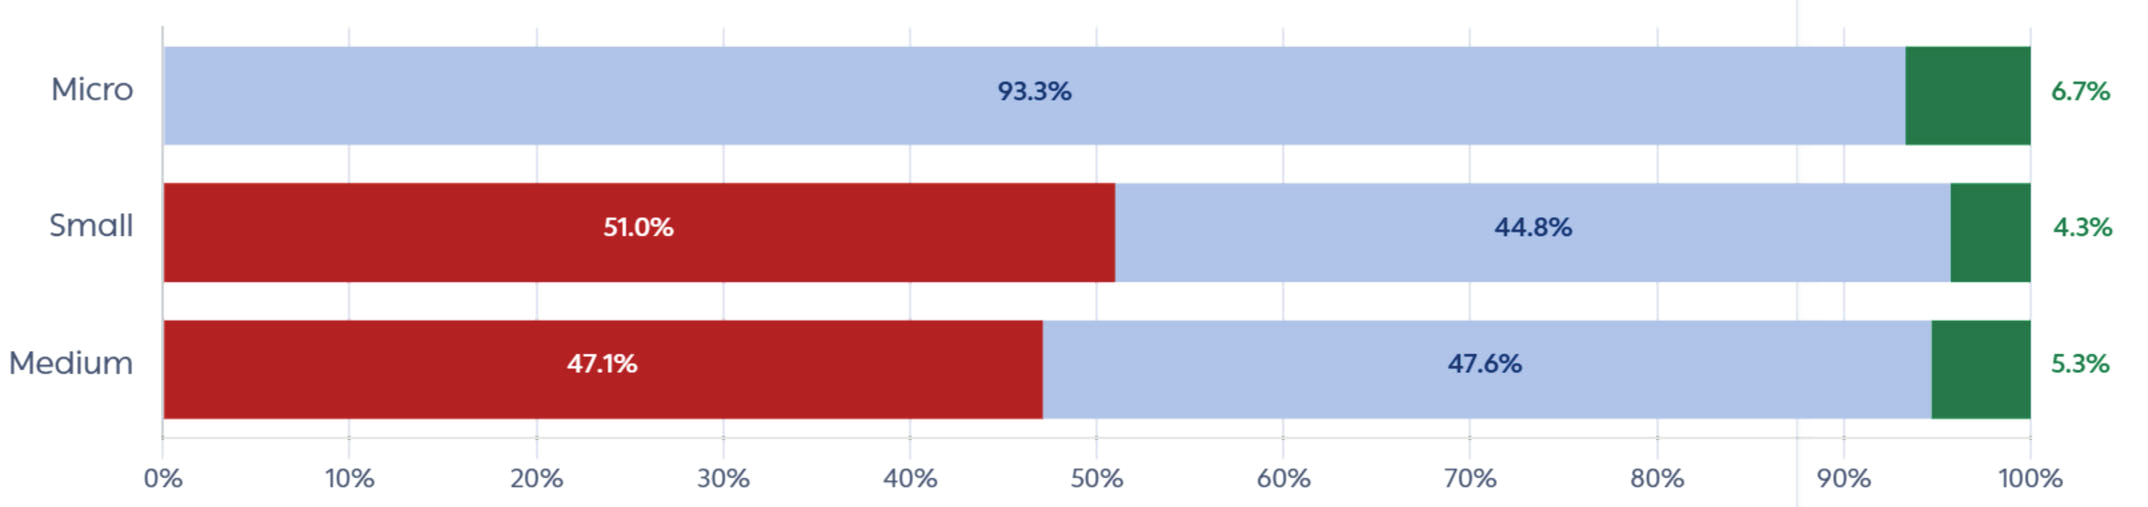
Enterprise mobility measures whether a business upgraded to a larger tier, stayed in the same tier, or downgraded during a five-year window. For 2021-2025, Micro enterprises had the highest national upgrade rate at 6.7%, equivalent to about one in 14. Small enterprises upgraded at 4.3%, while Medium enterprises moved into the Large tier at a rate of 5.3%.
Small enterprises faced the highest immediate downgrade rate: 51.0% moved back into the Micro tier. Among Medium enterprises, 47.1% moved down to Small or Micro, 47.6% remained Medium and 5.3% became Large.
Current national mobility, 2021-2025
National mobility: current versus past
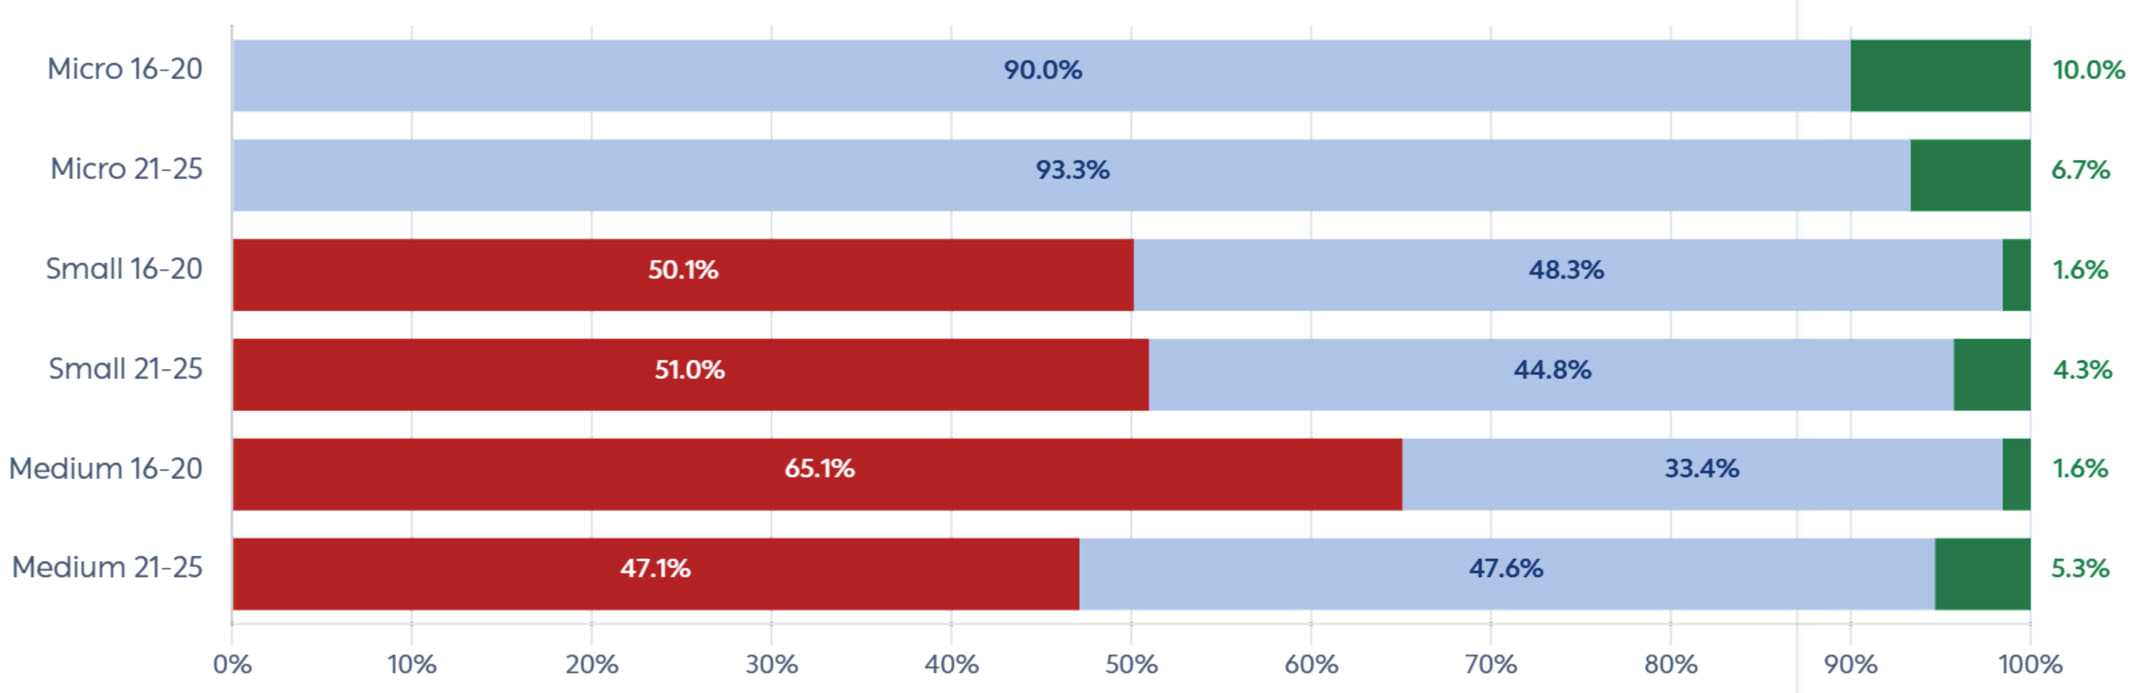
| Starting size and period | Downgrade | Stable | Upgrade |
|---|---|---|---|
| Micro, 2016-2020 | Not applicable | 90.0% | 10.0% |
| Micro, 2021-2025 | Not applicable | 93.3% | 6.7% |
| Small, 2016-2020 | 50.1% | 48.3% | 1.6% |
| Small, 2021-2025 | 51.0% | 44.8% | 4.3% |
| Medium, 2016-2020 | 65.1% | 33.4% | 1.6% |
| Medium, 2021-2025 | 47.1% | 47.6% | 5.3% |
4. Food and Beverage: fast growth with a harder scaling path
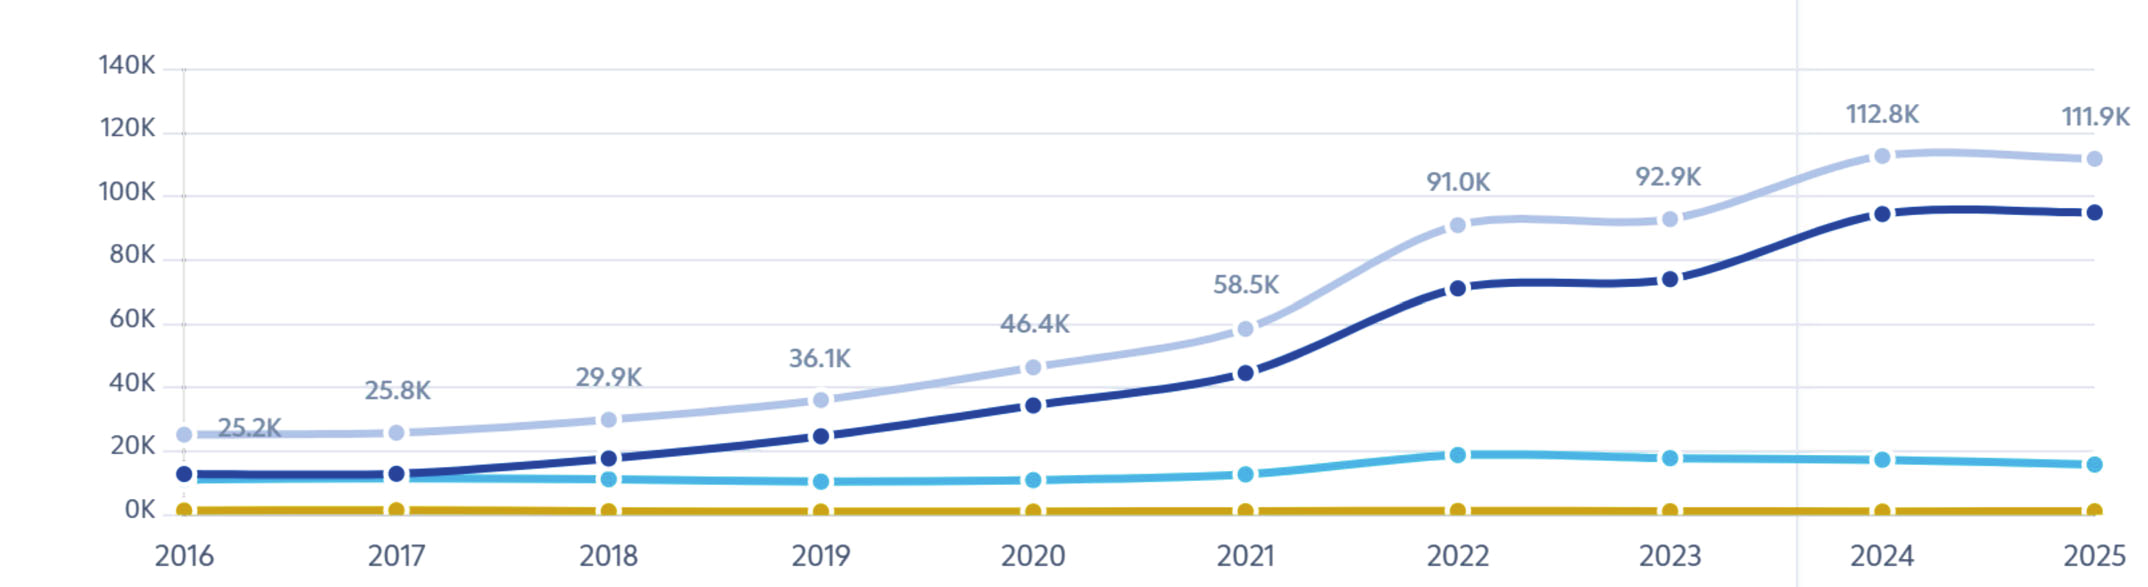
Food and Beverage MSM enterprises grew 4.4 times between 2016 and 2025, slightly faster than the national MSM base. Micro enterprises in the sector grew 7.4 times. Small F&B enterprises were the exception to the broader national pattern: they were 42.7% above their 2016 level even after declining from their 2022 peak. Medium F&B enterprises, meanwhile, fell by nearly a quarter from their 2017 peak.
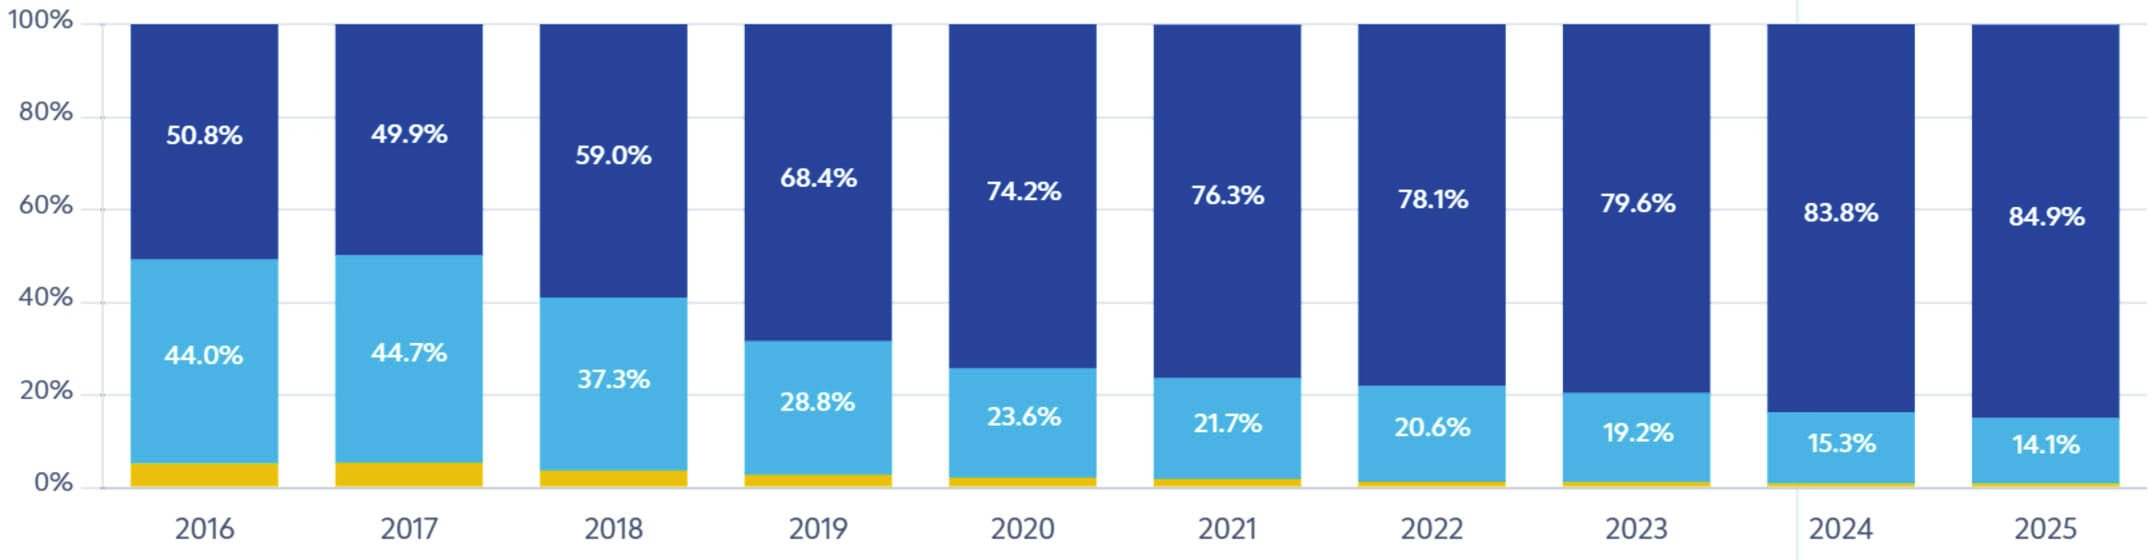
The sector’s structure also moved sharply toward Micro enterprises. In 2016, F&B was 50.8% Micro, 44.0% Small and 5.2% Medium. By 2025, the split was 84.9% Micro, 14.1% Small and about 1% Medium. F&B still retained a somewhat larger Small and Medium share than the national average, but the direction of travel was the same.
F&B enterprises by size, 2016-2025
F&B enterprise mix, 2016-2025
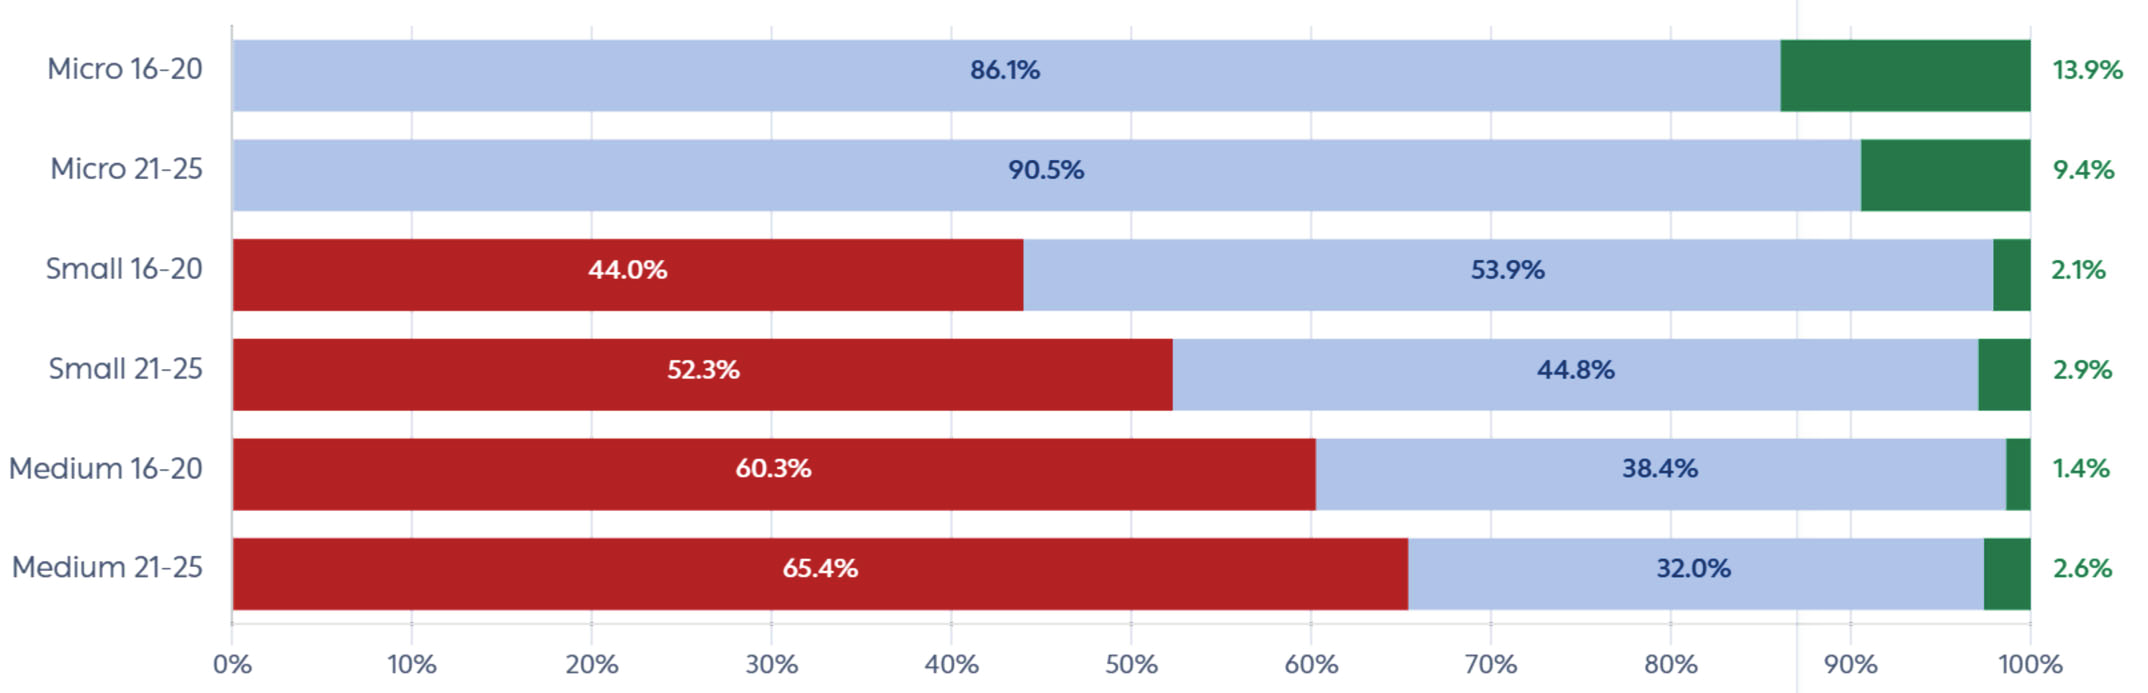
F&B mobility: 2016-2020 versus 2021-2025
What the sector data means
F&B offers more opportunities to graduate out of the Micro tier than the national average: its 2021-2025 Micro upgrade rate was 9.4%, compared with 6.7% nationally. The picture reverses for larger firms. Small F&B enterprises upgraded at 2.9% versus 4.3% nationally, and Medium F&B enterprises at 2.6% versus 5.3% nationally. Compared with 2016-2020, downgrade risk rose to 52.3% for Small and 65.4% for Medium F&B enterprises.
Commentary: The sector is creating many businesses, but fewer are holding or expanding at the Small and Medium levels. The report connects this pattern to visible operating changes such as restaurants reducing locations, closing branches, or moving toward delivery-only and cloud-kitchen models.
Methodology and definitions
- Scope: Micro, Small and Medium enterprises in Saudi Arabia. Large enterprises are included only as a possible upgrade destination in the mobility analysis.
- Enterprise trend: End-of-year active enterprise stock from 2016 to 2025 and annual new registrations from 2017 to 2025.
- Regional analysis: Active enterprises and 2025 registrations across all 13 Saudi regions. Regional enterprise density divides the 2025 active enterprise count by population from the 2022 Saudi census.
- Credit intensity: Total MSME credit outstanding from the Saudi Central Bank divided by the number of enterprises in the corresponding size tier. Results compare 2018 with 2025 and are shown on a logarithmic scale because the tier values differ substantially.
- Mobility: The share of enterprises that downgraded, remained stable or upgraded during two five-year windows: 2016-2020 and 2021-2025. An upgrade means moving into a larger size tier; a downgrade means moving into a smaller tier.
- Food and Beverage: The same enterprise trend, mix and mobility framework applied to the F&B sector.
- Growth rates: Compound annual growth rates and period changes are calculated from the underlying start and end values used in the report.
Sources
SME Data Consolidated, national and regional datasets; Q3 Newsletter analysis workbook for credit, density and Food and Beverage analysis; Saudi Central Bank MSME credit data; 2022 Saudi census population data; and client-provided SPA and Monsha’at SME Monitor material, including the December 2022 monitor cited in the report. Figures may not total exactly 100% because of rounding.
About this report: This publication is intended for market intelligence and general information. It does not constitute a financing offer or financial advice.